| echelle spectrographs |
|
We have seen that the diffraction-limited resolution of a spectrograph is given by R = Nn = Wn / d, where N is the total number of grooves in the grating, n the order of the spectrum, W the width of the grating and d the groove spacing. Hence, to increase R we can do one of three things:
If high-resolution spectroscopy is required, the easiest approach is to increase n which, from the grating equation, implies the use of increased angles of incidence and diffraction. A grating optimised for high-order work is known as an echelle, which comes from the French word for stairs (which describes the blazed profile of the grating). Echelle gratings do not need particularly high ruling frequencies as they operate in high orders. Typical echelles have 20-200 lines/mm and are blazed so that the maximum grating efficiency is in the range n = 10-100.
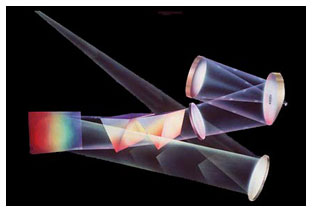
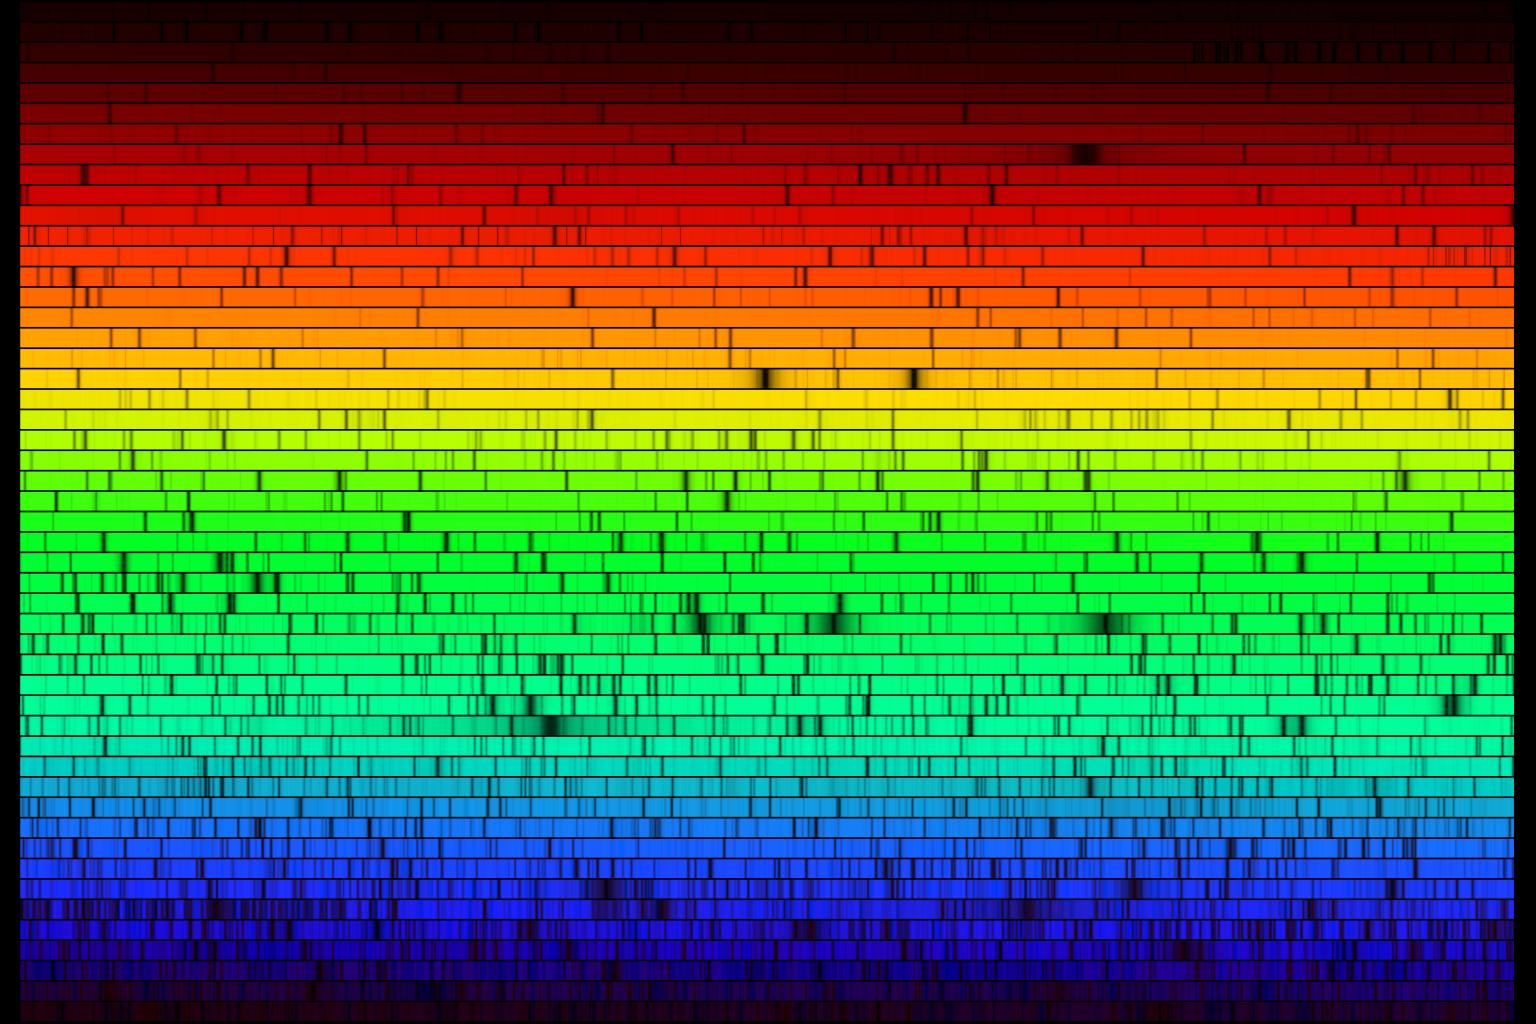
Simply inserting an echelle in place of a standard grating in a spectrograph, however, would result in multiply overlapping orders. The free spectral range is very small at high orders, hence order sorting filters are of limited use. The solution is to use an additional dispersing element, known as a cross disperser. The cross disperser, which can be either a low dispersion grating or prism, is usually mounted after the echelle grating with its dispersion axis perpendicular to it, as shown in the left-hand panel figure 99. This means that the overlapping orders are separated in the spatial direction on the detector, as shown in the right-hand panel of figure 99. Although each order has only a very narrow wavelength range, there are so many of them, each covering slightly different wavelengths, that very wide spectral coverage is achieved. To prevent the orders overlapping in the spatial direction, only a very short slit must be used. Echelle spectrographs (or high-resolution spectrographs) can deliver resolutions in excess of R = 100,000, and are most famously employed in the detection of extrasolar planets by measuring the tiny Doppler wobble of the host stars.
| figure 99: |
Left: schematic of the light path through the
Hamilton Echelle Spectrograph on the 3 m Shane Telescope at Lick
Observatory, California. Right: cross-dispersed Solar spectrum covering
almost the entire optical range, obtained using
the HIRES echelle
spectrograph on the 10 m Keck telescope, Hawaii. These orders are relatively
straight - some echelle spectrographs produce tilted and curved
orders, making data reduction quite challenging.
|