 |
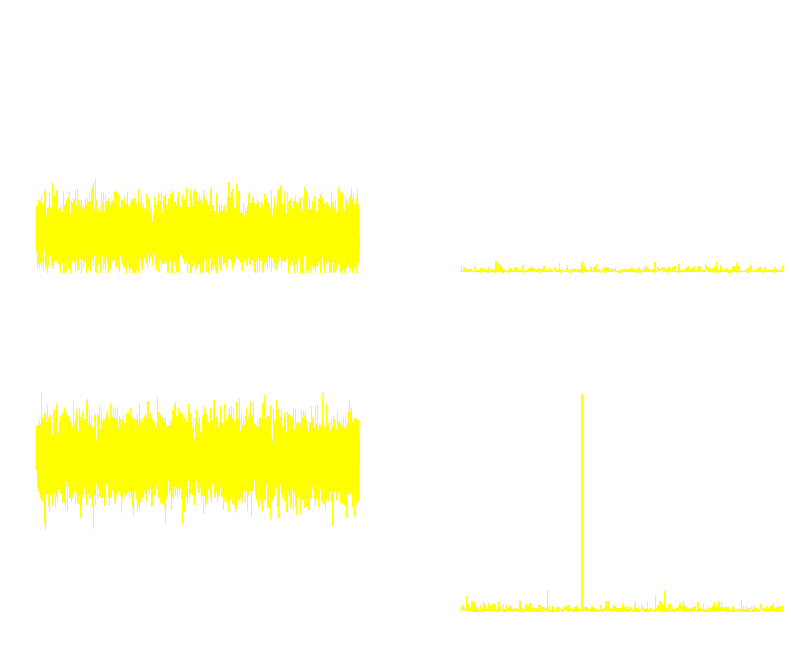
simulated light curves and power spectra (periodograms)
obtained with ULTRACAM on the WHT and SALT
|
 |
source is an R=16 variable star observed during bright time in 1" seeing
using 0.005 s exposures
|
 |
source varies with amplitude 2.5% and period 0.04 s
|
 |
light-curves are of limited use when acquiring
data at the highest rates - power spectra prove to be the most useful tools
|
 |
the advantages of using large-aperture telescopes are clearly
apparent - the 25 Hz peak is absent in WHT data but prominent in SALT data
|
