overview


      Vik Dhillon
University of Sheffield


Tom Marsh
University of Southampton


ultracam
studying astrophysics on the fastest timescales

ULTRACAM is an ultra-fast, triple-beam CCD camera which has been designed to study one of the few remaining unexplored regions of observational parameter space - high temporal resolution. The camera, which has recently been funded in full (£292 k) by PPARC, will see first light during 2001 and will be used on 2-m, 4-m and 8-m class telescopes in Australia, the Canary Islands, Chile, Greece, South Africa and Spain to study astrophysics on the fastest timescales.
             
science science
design design
performance performance      


science

The history of observational astronomy has shown that major advances in the science almost always result when a new area of observational parameter space, such as wavelength coverage, angular resolution, sensitivity or sky coverage, becomes accessible for exploration. ULTRACAM has been designed to study one of the few remaining unexplored regions of observational parameter space - high temporal resolution, as shown in figure 1.

 
figure 1: Observational parameter space.


The fastest timescale variations likely to be observed in an astrophysical environment are milliseconds, corresponding to the innermost orbits around neutron stars and black holes. Variations of faint sources on timescales longer than a few seconds have already been explored by conventional CCD instruments. ULTRACAM will explore the region of observational parameter space which lies between these two extremes, namely photometry of faint objects on timescales of seconds to milliseconds.

The resulting scientific applications of ULTRACAM are vast and include:
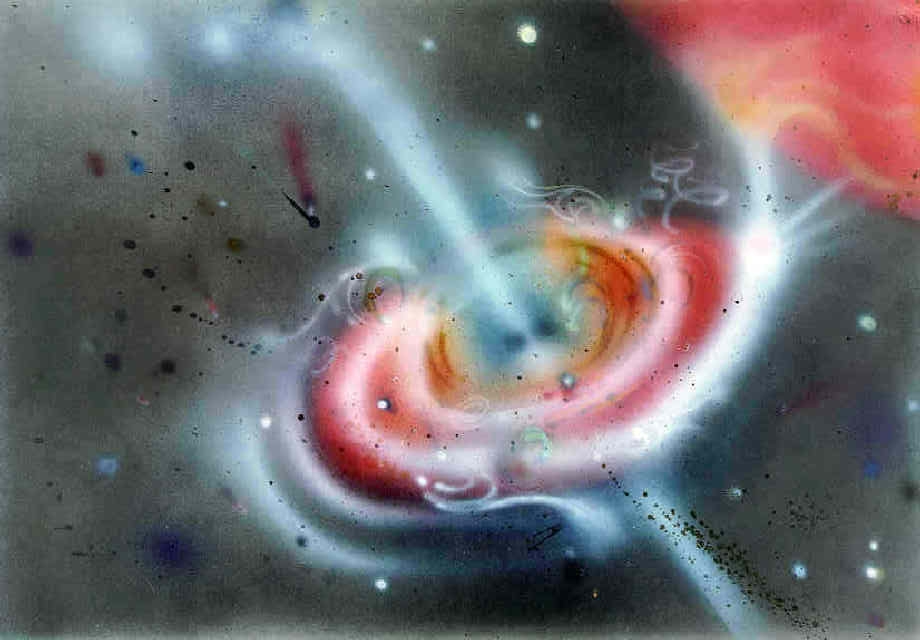
  • On timescales of milliseconds we will study the optical emission from pulsars. We will also search for the optical analogue of the kilohertz quasi-periodic oscillations (QPO's) and related small-scale accretion phenomena found in X-ray binary stars (XRBs), as depicted in figure 2.

     
    figure 2: Accretion processes in an XRB. Artwork by Catrina Liljegren, Bild & Form, Lund; ©Dainis Dravins, Lund Observatory.


  • On timescales of a hundredth of a second we will perform non-redundant-mask imaging of nearby giant stars.
  • On timescales of a tenth of a second we will construct echo maps, enabling the geometries of cataclysmic variable stars (CVs) and XRBs to be determined, and search for QPO's and dwarf-nova oscillations (DNOs) in CVs.
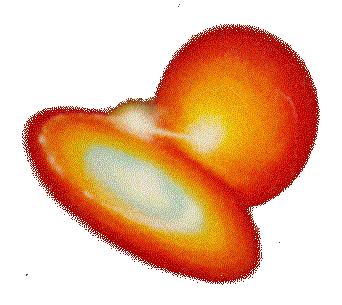
  • On timescales of a second we will measure the sharp ingress and egress of the eclipse of white dwarfs in close binary stars, thereby determining their masses and radii for comparison with theory, and construct eclipse maps of the accretion discs in CVs (see figure 3).

     
    figure 3: The orbit of an eclipsing cataclysmic variable.


The five essential requirements for such work are:
  1. Short exposures with minimal dead-time between exposures.
  2. Multi- (3 or more) band data covering the whole optical range in order to distinguish a blackbody from a star, i.e. with only 2 bands you cannot distinguish a blackbody from a star, but with 3 bands you can.
  3. Simultaneous recording of the different wavelength bands, due to the fact that accreting systems display erratic flickering which cannot be reliably disentangled from colour variations in sequentially acquired data.
  4. Simultaneous recording of at least one comparison star in order to provide differential photometry and hence increase the accuracy of the variability studies and to allow measurements to be taken in non-photometric conditions.
  5. Low-noise, high quantum-efficiency detectors and large aperture telescopes.
These requirements result in the instrument design presented here.


design

optics

The proposed optical layout of ULTRACAM is shown in figure 4. There are four optical units - the collimating fore-optics, the dichroic beamsplitters, the filters and the re-imaging lenses. The collimating fore-optics will collimate the light from the telescope. This will be an interchangeable lens unit which will enable ULTRACAM to work on telescopes of different focal ratio whilst retaining the same pixel scale (0.3 arcseconds/pixel). The light is split into blue (u), green (g) and red (r, i or z) wavelengths by two dichroic beamsplitters and then passes through a filter. We have chosen to use the ugriz filter system defined by the Sloan Digital Sky Survey (SDSS), for three reasons. First, the ugriz system is likely to become the dominant photometric system of the future. Second, the overlaps between the ugriz bandpasses are minimal compared to the overlaps in the UBVRIZ filter-set, which will minimize the problems associated with using dichroics to split the light between the filters. Third, the SDSS r filter has a curtailed red wing compared to the Cousins R filter, which means that fringing with the thinned chips will be non-existent in r. On passing through the filters, the light is re-focussed onto the CCD chip using re-imaging optics positioned in front of the detectors.

 
figure 4: Schematic representation of ULTRACAM.


mechanics

All of the optics will be interchangeable by hand, i.e. there are no moving parts in ULTRACAM, which simplifies the design (and reduces the cost) considerably. A single opto-mechanical chassis will house all of the optics and will provide mounting points for the 3 CCD heads. An interchangeable flange at the collimator end will enable attachment to a variety of Cassegrain turntables. Note that mechanical flexure is not of great concern as ULTRACAM is primarily an imaging photometer. The above design ensures that ULTRACAM will be a simple, compact, lightweight and hence portable instrument.


detector system

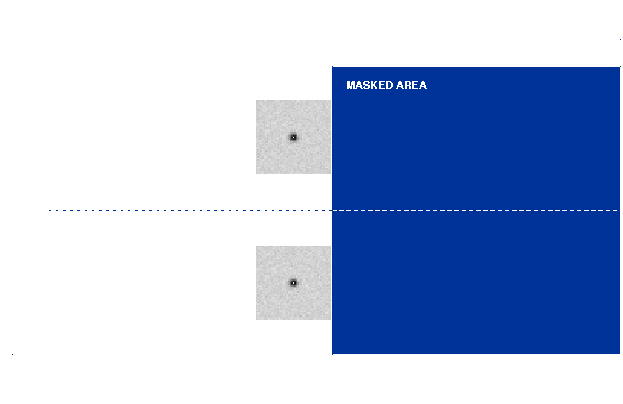
We will use three back-illuminated, thinned, figure 5. The chips will be cooled using a three-stage peltier device and water chiller, resulting in dark current of only 0.1 e-/pixel/s. This is insignificant compared to the sky counts, which in the worst case (the U-band La Palma dark sky on a 2-m telescope) gives 0.3 e-/pixel/s. The chips will be coated by Marconi with their broad-band coating, resulting in quantum efficiencies of between 35-84% in the ugriz band-passes.

The use of frame transfer chips is essential, as it provides a means of taking data in the imaging area whilst data in the masked area is being read out. As long as the exposure time is longer than the time it takes to read the data, the dead-time is essentially zero. Hence, for small windows it is possible to take 0.001 s exposures with negligible (0.0001 s) dead-time, thereby meeting the scientific requirements outlined above. Even full-frame images can be read out with millisecond dead-times as long as the exposure times are no shorter than approximately 1 s. Potential users of ULTRACAM should consult the on-line dead-time calculator for further information.

 
figure 5: Schematic representation of one of the ULTRACAM CCD chips.


The Marconi CCD47-20 chips have imaging areas of 1024x1024 pixels (each of 13 µm). Such a large chip format gives a high probability of finding comparison stars which are brighter than our target stars. This is an essential pre-requisite for accurate differential photometry. With a pixel size of 0.3 arcseconds/pixel and observing at a galactic latitude of 30o (approximately equal to the all-sky average), the Marconi CCD47-20 chips cover approximately 5 arcminutes and provides us with an 80% probability of finding a comparison star of magnitude R =12, which is far brighter than virtually all of our intended target stars. Potential users of ULTRACAM should consult the on-line comparison-star probability calculator for further information.


data acquisition and reduction system

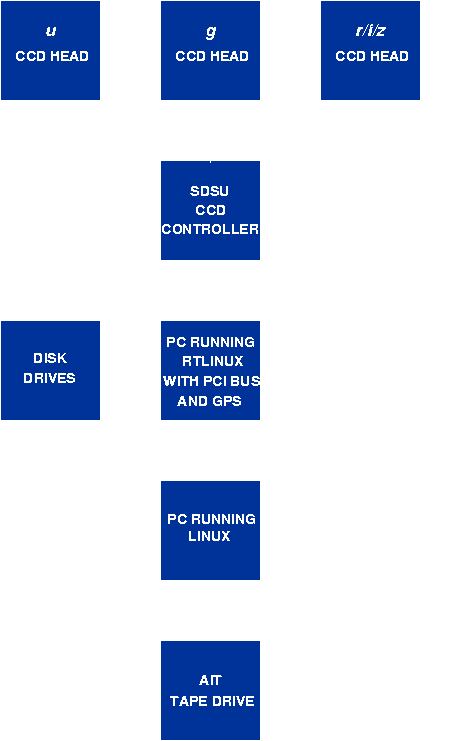
Figure 6 shows the principal components of the ULTRACAM data acquisition system. The CCDs will be controlled by a San Diego State University (SDSU) controller, provided by Bob Leach. A single SDSU controller will be able to read out all three CCD chips in two-channel mode, giving readout rates of approximately 3 µs/pixel/readout channel with 5 e- readout noise. The data will then be transferred from the SDSU controller to a PC running real-time linux, via a PCI bus (which provides data buffering in order to maintain the highest data rates). Using a GPS receiver connected to the PC, we will time-stamp all exposures with ULTRACAM to an absolute accuracy of better than 0.1 milliseconds.

 
figure 6: Data acquisition system.


Figure 6 also shows the maximum data-flow permissible by each component of the ULTRACAM data acquisition system. It can be seen that data will flow from the CCD chips at a maximum rate of 3.6 Mbytes/s. This sets the maximum data rate of ULTRACAM as all of the other components in the data acquisition system are able to cope with higher data rates than this. Given this maximum data rate, we could accumulate as much as 130 Gbytes of data in the course of a 10-hour night. Such vast quantities of data demand two things - disk space sufficient to store at least one nights data and an archiving medium with sufficient capacity and speed to backup at least one nights data before the next night begins. The former will be provided by a 130 Gbyte stack of hard disks; the latter will be provided by an autoloading AIT tape drive. With this in place, it will be possible to observe for a whole night at the highest data rates without stopping and then archive the data by the time the following night begins.

Without some form of pipeline reduction, it will simply not be feasible to reduce the terrabytes of data produced in a typical observing run with ULTRACAM. Such a pipeline data reduction system will also allow an immediate assessment of the data, essential for the study of variable objects. We have simulated the performance of a pipeline data reduction system for ULTRACAM and we find that, using a top-end PC running linux, it will indeed be possible to reduce ULTRACAM data at the same rate as it is taken, thereby allowing us to build up light curves in real time.


performance

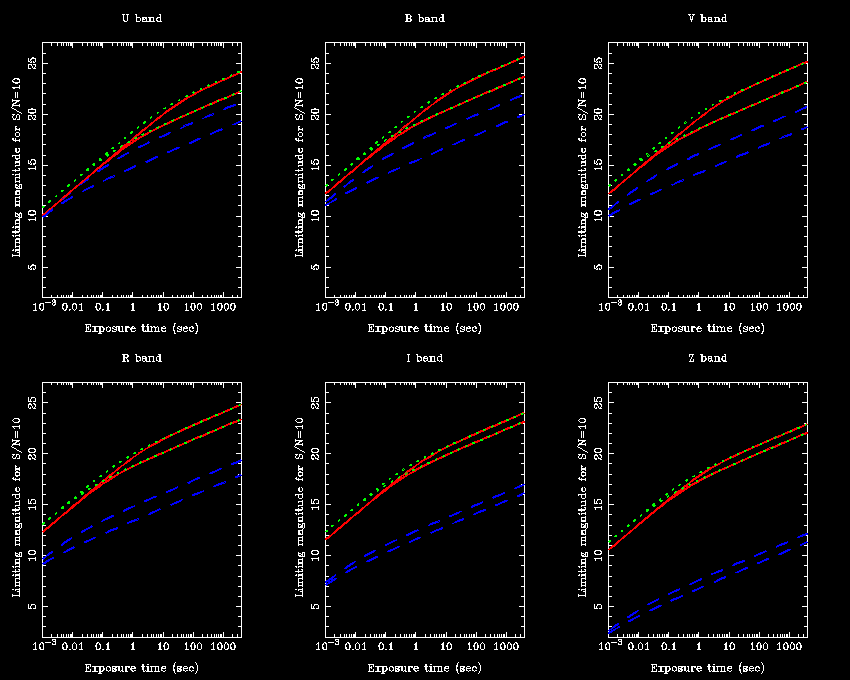
In figure 7 we show the limiting magnitudes for a detection with ULTRACAM (at a signal-to-noise of 10) as a function of exposure time at the GHRIL focus of the 4.2-m William Herschel Telescope (WHT) on La Palma. Each panel corresponds to a different bandpass - U, B, V, R, I and Z. In each panel there are 6 curves. The solid curves are for ULTRACAM, with the upper curve representing dark time and the lower curve bright time. The dotted curves are also for ULTRACAM, but using on-chip binning of 3x3 pixels (giving 0.9 arcsecond pixels). The dashed curves are for a photoelectric photometer, again with the upper curve representing dark time and the lower curve bright time. Changing the telescope from the WHT to the 9.1-m South African Large Telescope (SALT) results in an upward displacement of the curves by ~1 magnitude. Similarly, changing the telescope to the 2.2-m Aristarchos Telescope in Greece results in a downward displacement by ~1 magnitude. When calculating the limiting magnitudes we have used, wherever possible, the parameters (e.g. sky brightness, extinction) given by the signal program written by Chris Benn for the ING telescopes. For all other parameters (e.g. seeing, throughput of the telescope and ULTRACAM optics) we have been careful to adopt realistic values so as to accurately reflect the expected performance of ULTRACAM. Potential users of ULTRACAM should consult the on-line signal-to-noise ratio calculator for further information.

 
figure 7: Limiting magnitudes of ULTRACAM on the 4.2-m WHT.


Figure 7 shows that ULTRACAM is always significantly more sensitive than a photoelectric photometer, is some cases by over 10 magnitudes. Figure 7 also allows us to make an informed decision on which telescope to use given the scientific requirements of a particular project. For example, when studying the black-hole transients, which are typically fainter than 18 in quiescence, it will be necessary to use SALT in order to obtain time resolutions significantly less than 0.1 seconds. On the other hand, studies of most CVs (which are typically 14-16 in quiescence and a few magnitudes fainter in eclipse) on timescales of a second could be accomplished on Aristarchos, the 2.0-m Liverpool Telescope on La Palma, the 2.5-m Isaac Newton Telescope (INT) on La Palma or the 1.9-m Radcliffe Telescope in South Africa. When looking at shorter timescale variations, however, such as when doing echo mapping experiments which typically require 0.1 s exposures, we would use the WHT or the 3.9-m Anglo-Australian Telescope.

 
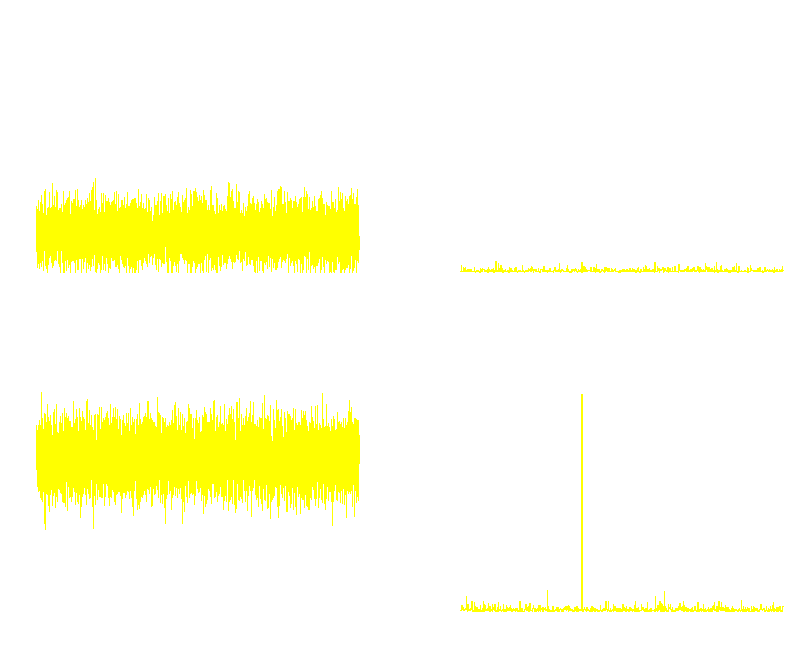
figure 8: Simulated light-curves and periodograms obtained with ULTRACAM on the 4.2-m WHT and 9.1-m SALT.


In figure 8 we show simulated light-curves and periodograms obtained with ULTRACAM on the WHT and SALT. The source is an R =16 variable star observed at the zenith during bright time in 1 arcsecond seeing using 5 millisecond exposures. The source is varying with an amplitude of 2.5% and a period of 40 milliseconds. It can be seen that light-curves are of only limited use when acquiring data at the highest rates and, in fact, it is periodograms which prove to be the most useful tools (in this case, finding that the data exhibits a 25 Hz modulation). The advantages of using large-aperture telescopes are also clearly apparent in figure 8, in which the 25 Hz (i.e. 40 millisecond) peak is non-existent in the WHT data but is very prominent in the SALT data.


For further information on the ULTRACAM project, please contact Vik Dhillon or Tom Marsh.