
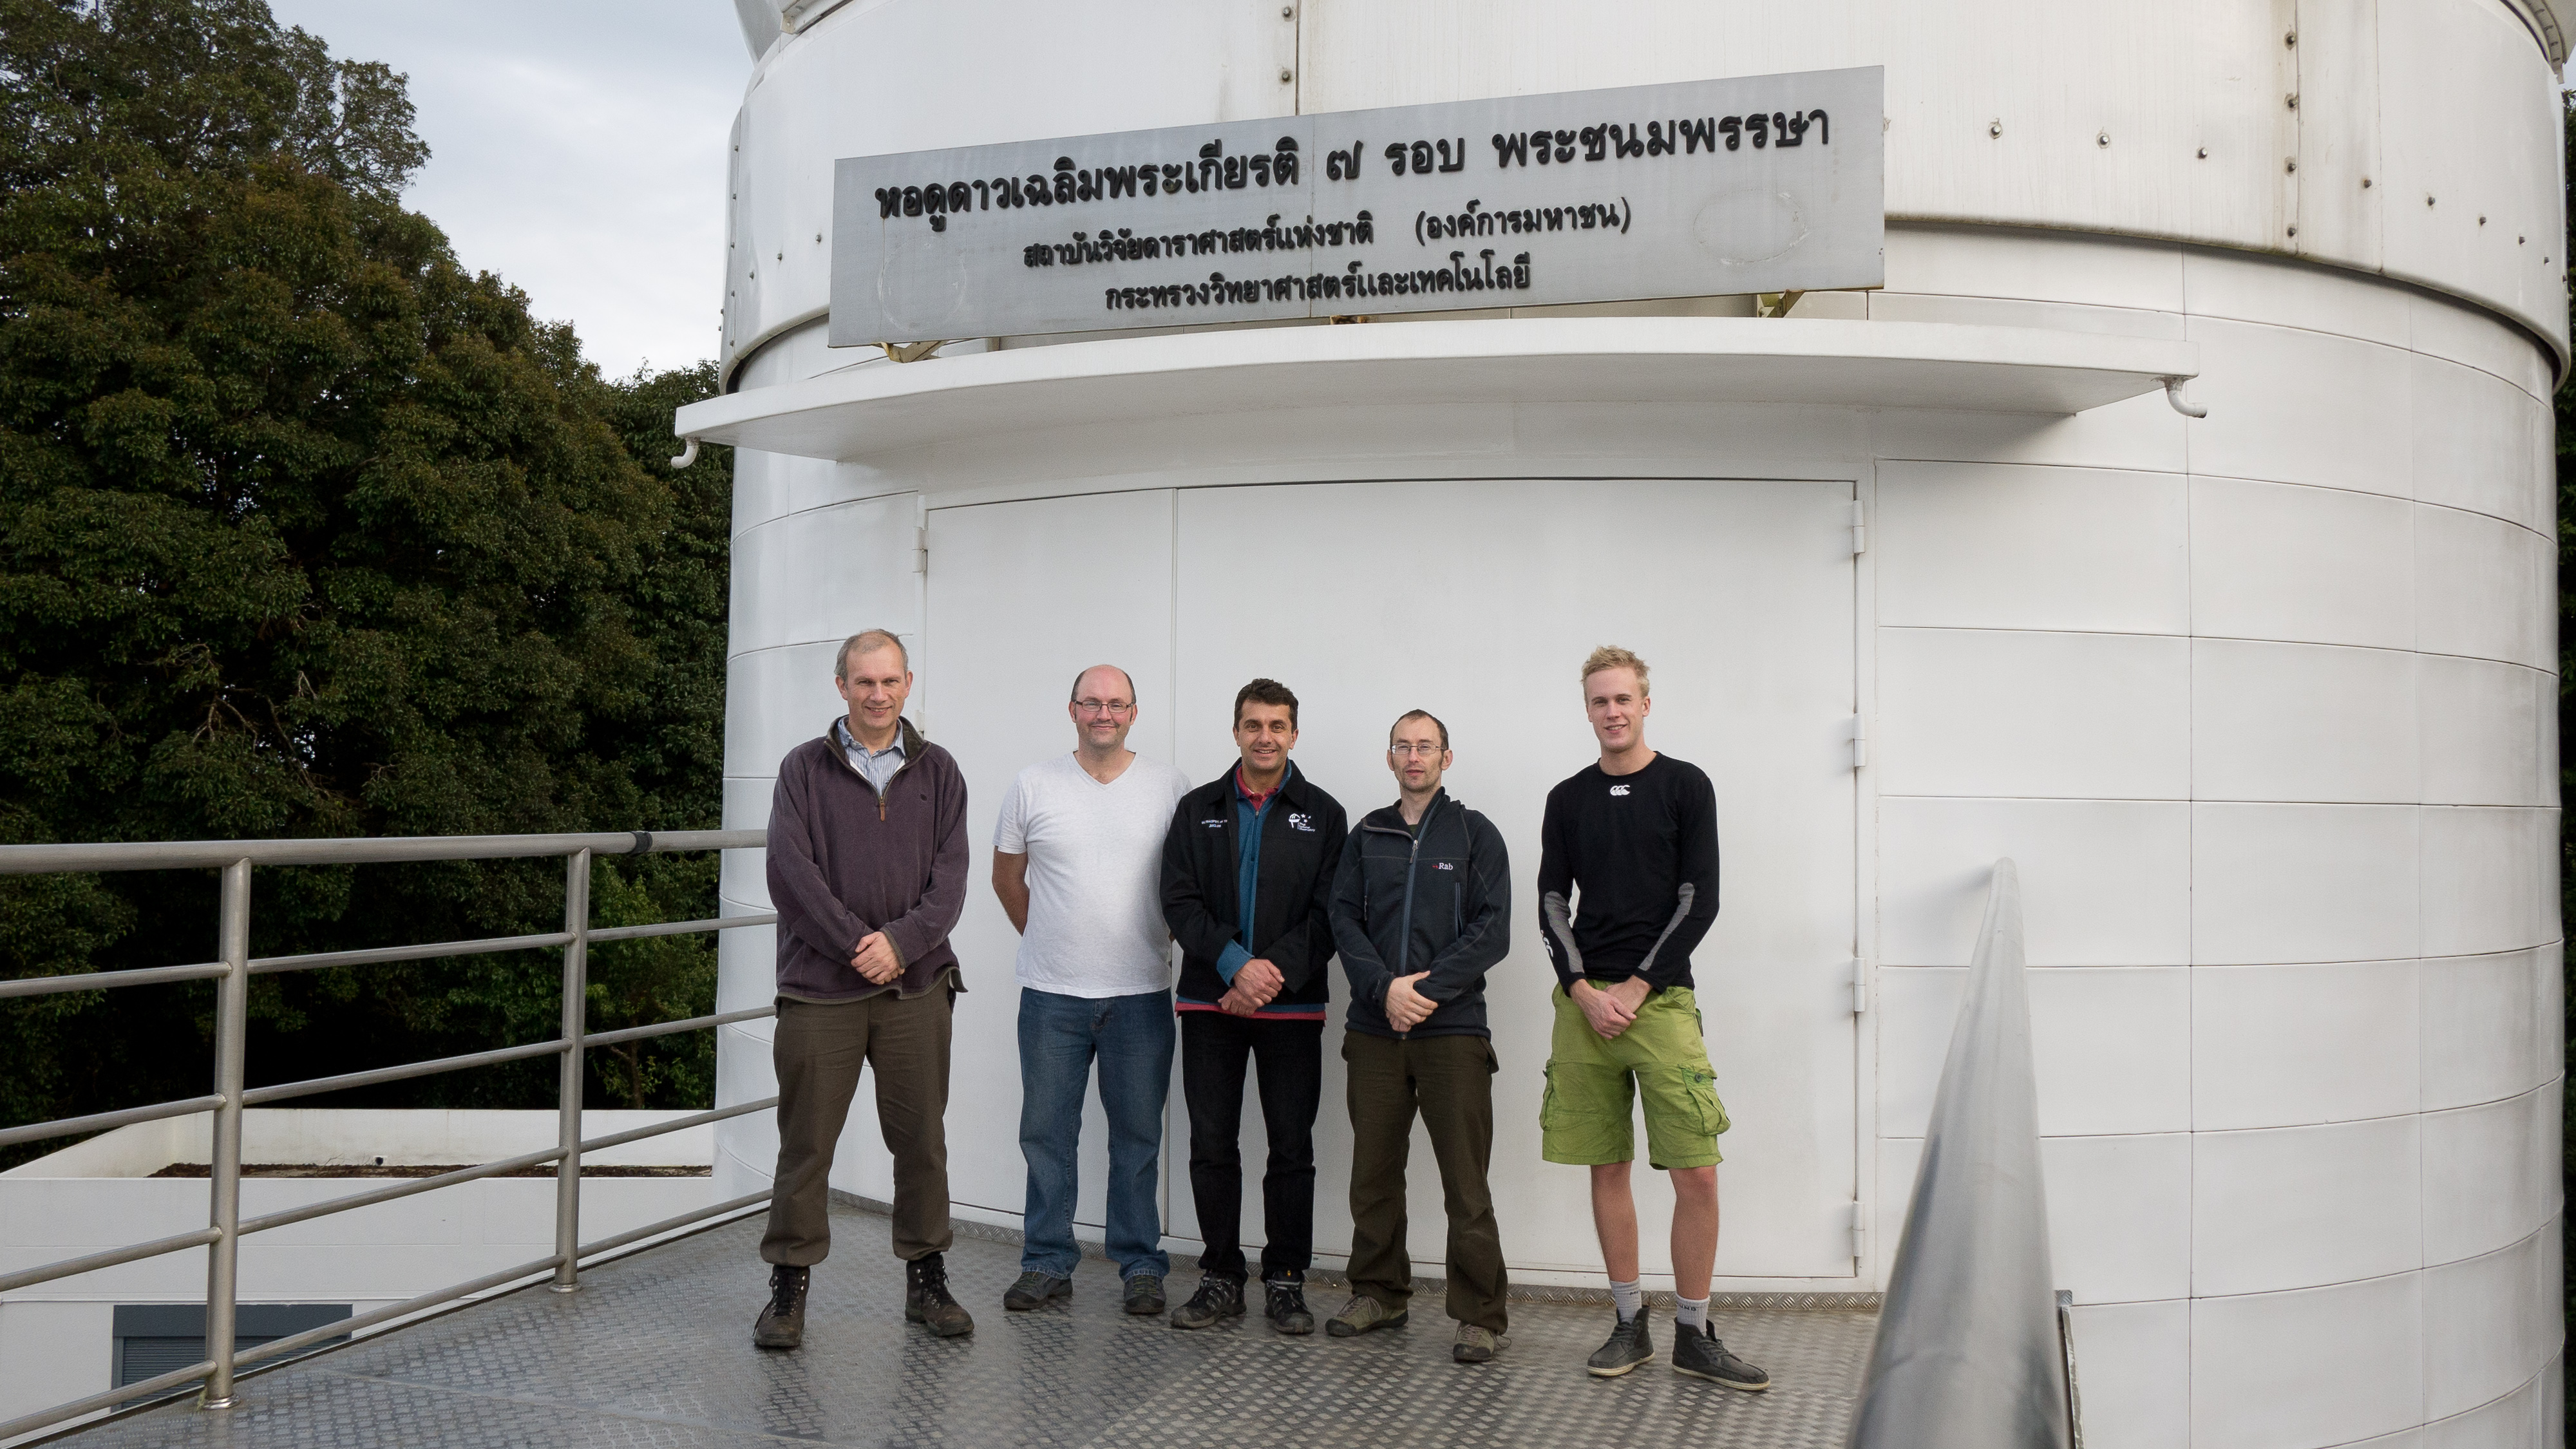
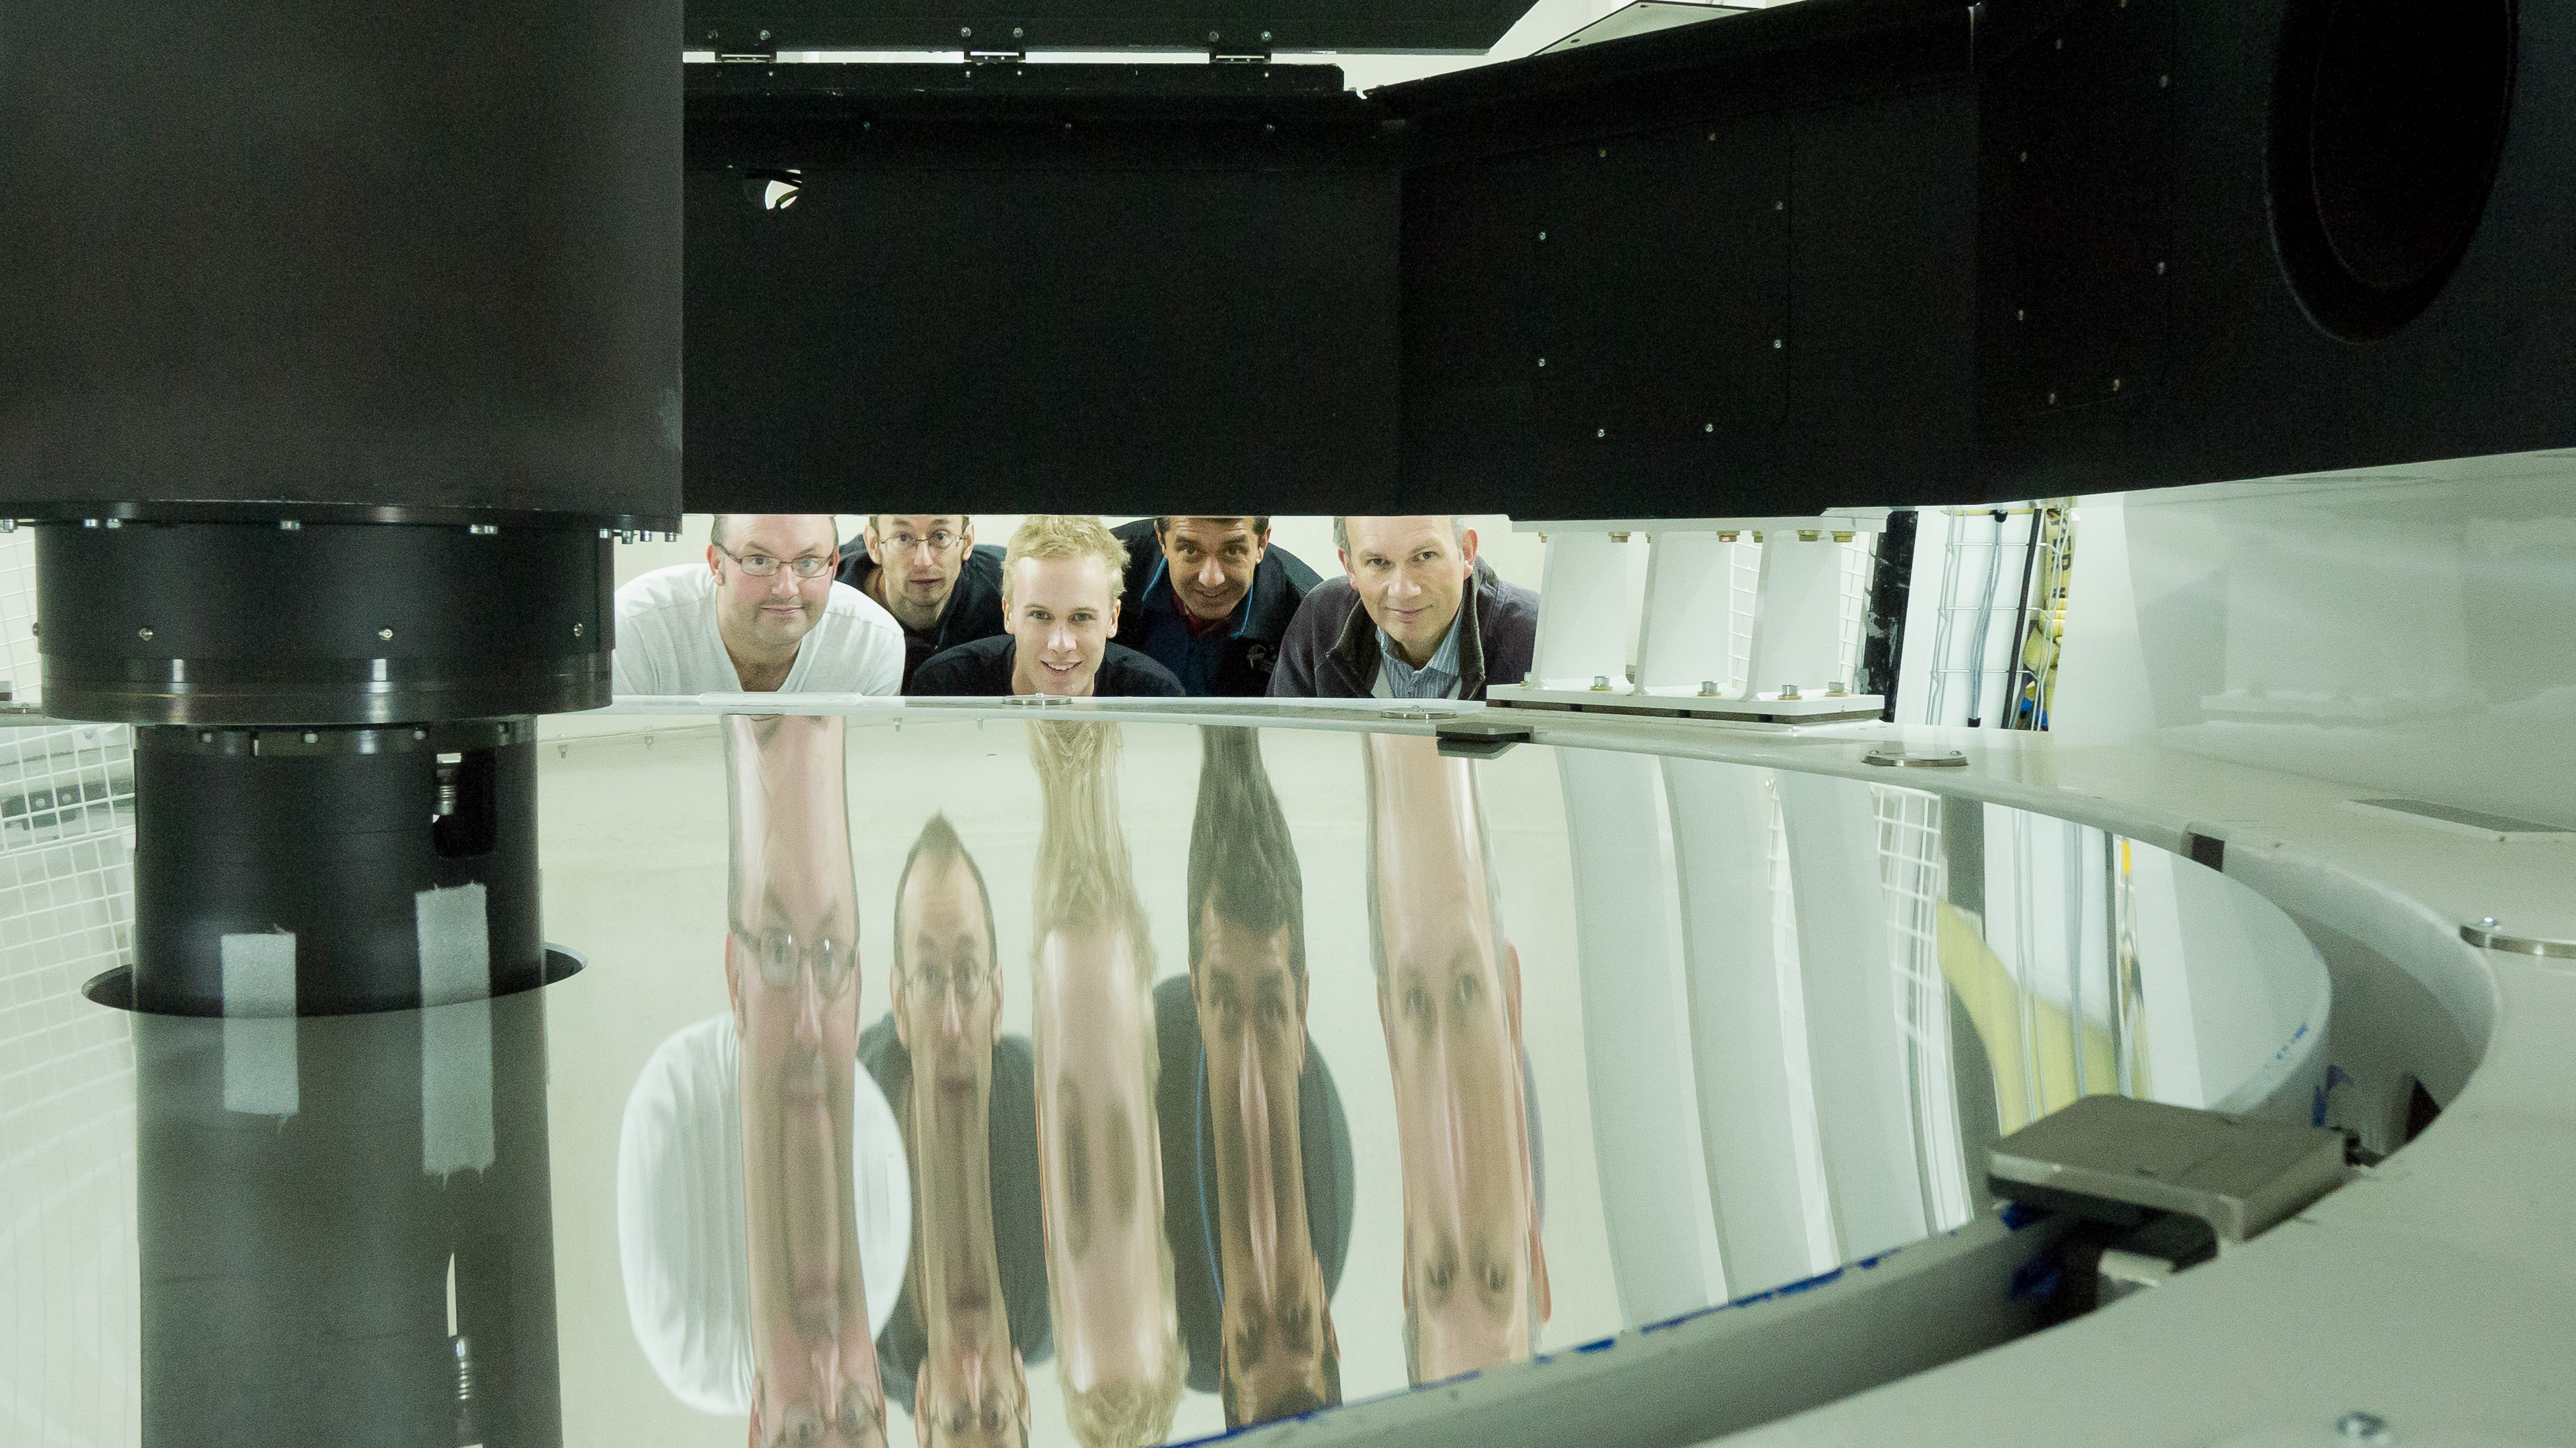
This document describes the on-sky commissioning of ULTRASPEC on the 2.4m TNT on the nights of 2013 November 5-8. The instrument was commissioned by a team comprised of Vik Dhillon, Tom Marsh, Stu Littlefair, Paul Kerry and Liam Hardy - see photos below. Note that every image shown on this page can be clicked on to obtain a full-sized version.
During the afternoon before the first commissioning night, we measured the readout noise, dark current and gain of the EMCCD with the chip cold (160 K) and the dome dark. We obtained values in accordance with our previous measurements at the TNT, indicating that the EMCCD was operating correctly. For the record, the readout noise in normal/slow mode was 3.2 counts, the gain was 0.8 electrons/ADU, the dark current was 6 counts/pix/hr, and the avalanche gain was 700. For comparison, please refer to the ULTRASPEC detector page.
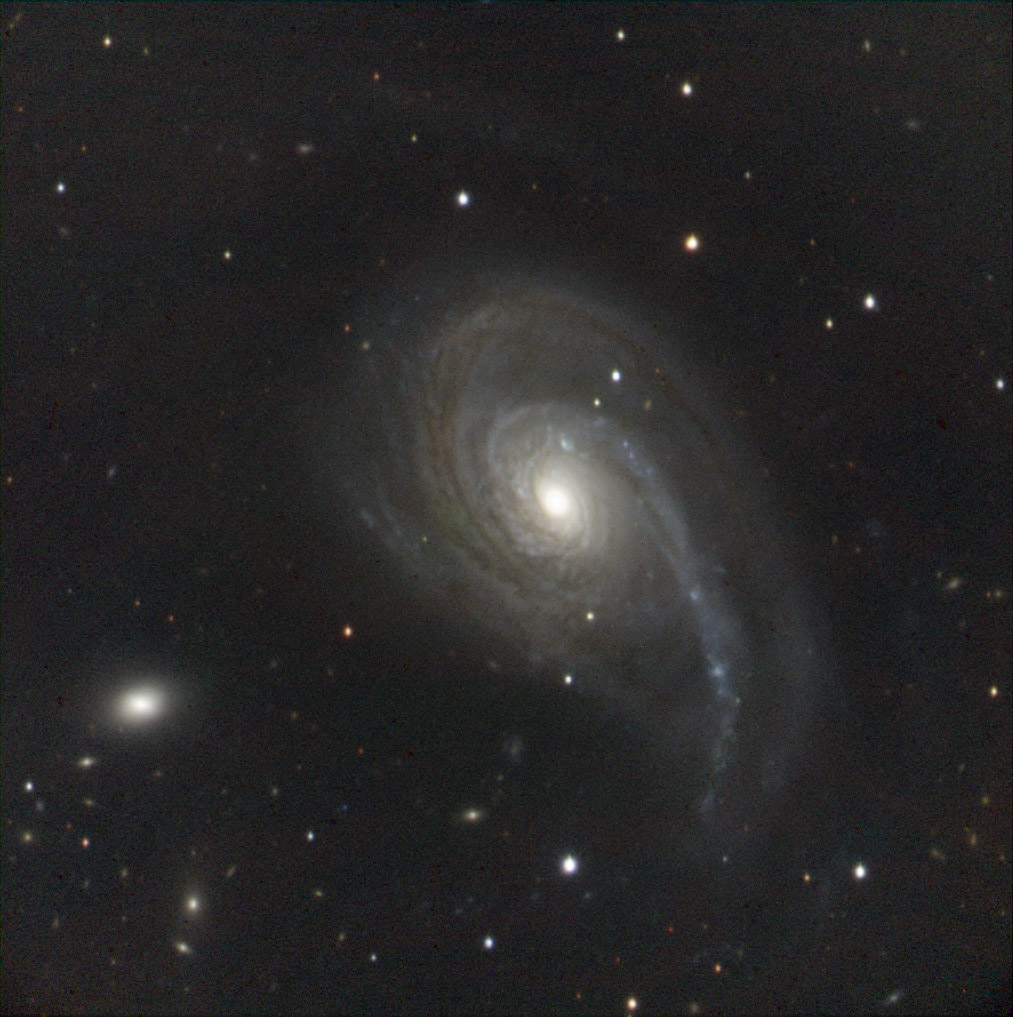
Below is our "official" first-light image with ULTRASPEC on the 2.4m TNT, obtained on 2013 November 5. The image is of the Nautilus Galaxy (NGC 772), an unbarred spiral galaxy of type Sb at a distance of 30 Mpc. The image is composed of three separate exposures in g', r' and i', each of 180 s duration.
Towards the end of commissioning, we also obtained this movie showing the motion of Comet C/2012 S1 (ISON). The movie is made up of 14 x 60 s exposures in g'. These data were taken in morning twilight and so you can clearly see the sky getting brighter and the problem we have with scattered light at the centre of the field of view.

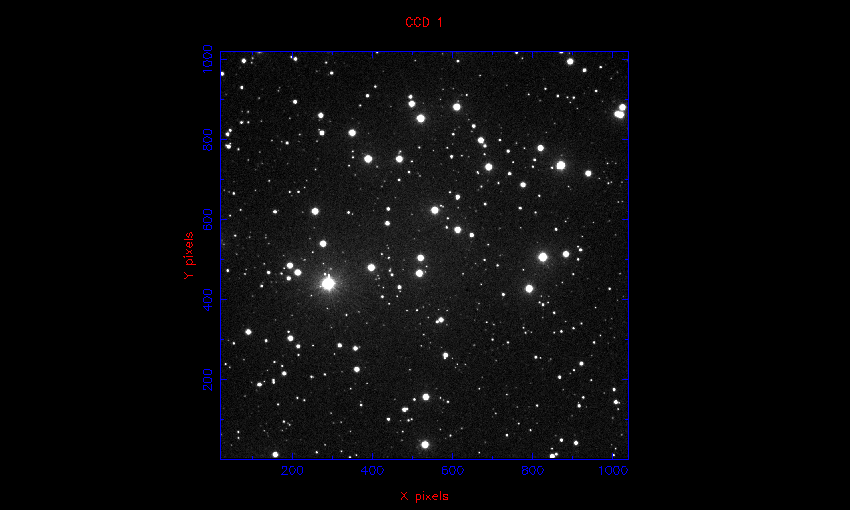
In order to assess the image quality of ULTRASPEC, we slewed to the open cluster NGC 6940 and focused the telescope using g' exposures of duration 3.7 s, finding an optimum secondary-mirror position of -0.52 mm. An image of the cluster is shown below: strictly speaking, this was first light with ULTRASPEC!
We then rapidly cycled through the filters, taking images of the cluster in each filter. By measuring the FWHM of all of the stars in each image, we were able to produce a map of the image quality in each band, as shown below: from left-to-right, u', g', r', i' and z'. In each image, the red spots indicate the locations of stars, with their radii proportional to their FWHM, and the numbers next to the spots giving the FWHM of the stellar profiles in units of pixels (where 1 pixel = 0.452") - click on each image for an expanded view.
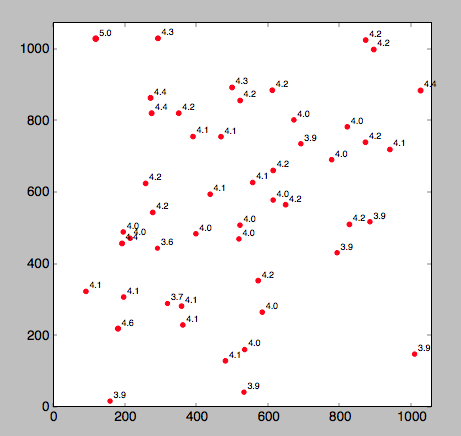

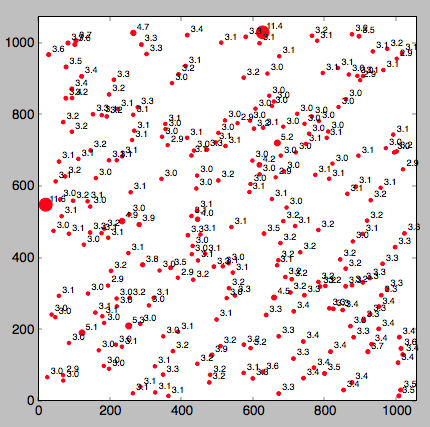
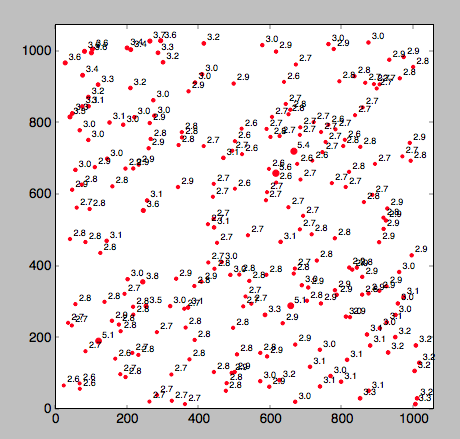
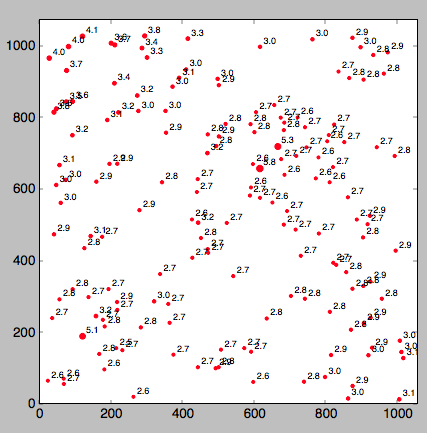
The following conclusions can be drawn from the above FWHM maps:
In order to understand the degradation in image quality at the extreme top-left corner of the images, we inspected our measurements of the image quality using the artificial star field in Sheffield. We found exactly the same effect in these lab images, indicating that the problem is due to the instrument and not the telescope. We then checked the EMCCD depth measurements we made at the UKATC and found that the corner of the chip exhibiting the larger FWHM lay 0.1mm away from the plane defined by the other three corners. We interpreted this at the time as due to the chip being slightly warped in this corner. The NARIT optical designer, Christophe Buisset, then ran a Zemax model of ULTRASPEC where the chip is 0.1mm from its nominal position and found that this would result in a FWHM approximately 1 pixel larger, exactly as seen. Hence the degradation in image quality in the extreme top-left corner is most likely due to the chip warp, and therefore the ULTRASPEC and telescope optics appear to be operating correctly.
A further test of the image quality was obtained at the start of the night of 2013 November 6, when the seeing was only 1.8 pixels (0.8") in r'. The plots below show a zoom-in of the star (V1315 Aql), which was located towards the upper left-hand corner of the field, along with the radial profile. The fact that we can observe a FWHM of below 0.9" (2 pixels) indicates that the optics are working as designed.


In order to determine the plate scale and orientation we processed the images of the cluster NGC6940 described above using astrometry.net, which gave the following results:
We also checked that there is no image shift as a function of wavelength by measuring the position of the same star near the centre of the field of view in u', g', r', i' and z' frames. These images were taken in rapid succession so as to minimise image shift due to telescope tracking errors. We found pixel positions of (582,262), (583,261), (584,261), (584,260), (584,260), respectively, indicating that there is no significant image shift as a function of wavelength, as expected.
With the rotator at sky position angle 0, the orientation of the detector is as depicted in the image below:
We then rotated the telescope rotator through 180 degrees and measured the position of the rotator centre on the EMCCD. We found that it lay at pixel position (524,475). This is (-4,-37) pixels (i.e. -1.808,-16.724 arcseconds) from the central pixel of the EMCCD, which lies at (528,512). Hence the rotator centre and chip centre are very well aligned. Note that the pointing model is referenced to the rotator centre and the measured pointing accuracy of the telescope is only 2" rms, hence most targets should be acquired very close to the chip centre, as desired.
Given the good image quality we concluded that there was no need to recollimate the telescope. This was confirmed by the NARIT optical designer, Christophe Buisset, who attempted to tweak the secondary mirror position immediately after these commissioning observations using the NARIT test CCD camera: he found no improvement was possible. We also concluded that, given the good co-alignment of the chip and rotator centres, there was no reason to tweak the alignment of the quarternary mirror in the cube (M4).
We measured the throughput of ULTRASPEC by observing the SDSS standard star Feige 22 on 2013 November 5 in photometric conditions. The measured counts have been compared to the predictions given by the ULTRASPEC ETC, which uses zero points scaled from the values we measured with ULTRASPEC at the 3.5m NTT in Chile. The NTT zero points, defined as the magnitude of a star above the atmosphere that gives 1 e-/sec in each filter, are:
To scale these to the TNT, we need to scale for the smaller mirror and the extra reflection at M4. Hence the TNT zero point is given by subtracting 2.5*log10(3.5**2/0.9*[2.4**2]) = 0.93 magnitudes from the NTT zero point, resulting in:
With the standard star at an airmass of 1.08, we measured the following in a 12.78 second exposure in each filter:
It can be seen that the g' and r' are more sensitive than predicted, i' is as predicted, and both u' and z' are less sensitive than predicted. These are only preliminary results and depend upon the assumption that the extinction has La Palma values, i.e. 0.5, 0.19, 0.09, 0.05 and 0.04 in u', g', r', i', z', respectively. We have also assumed, of course, that the re-imaging optics on the NTT are equivalent to those of ULTRASPEC on the TNT, whereas we know the latter have significantly more elements, perhaps explaining why the u' and z' throughput is lower than predicted.
We took flat fields of a blank area of the sky near the zenith at twilight, with the telescope spiralling. The results are shown below:
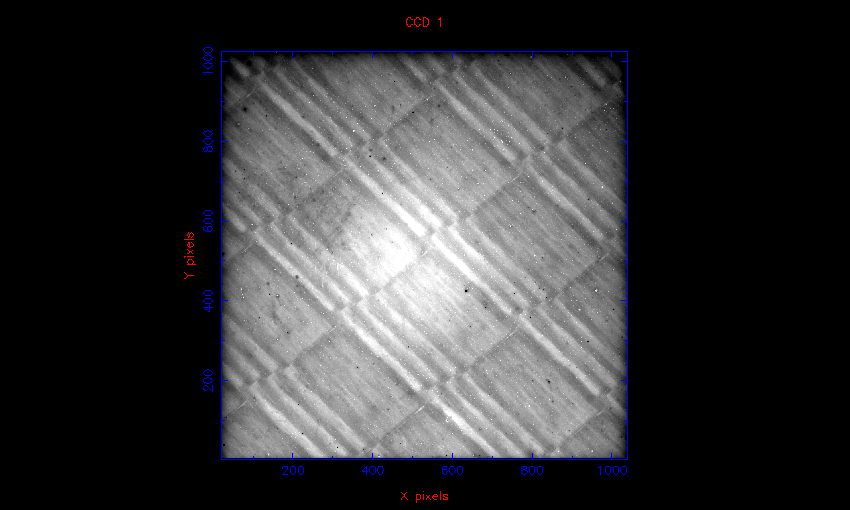

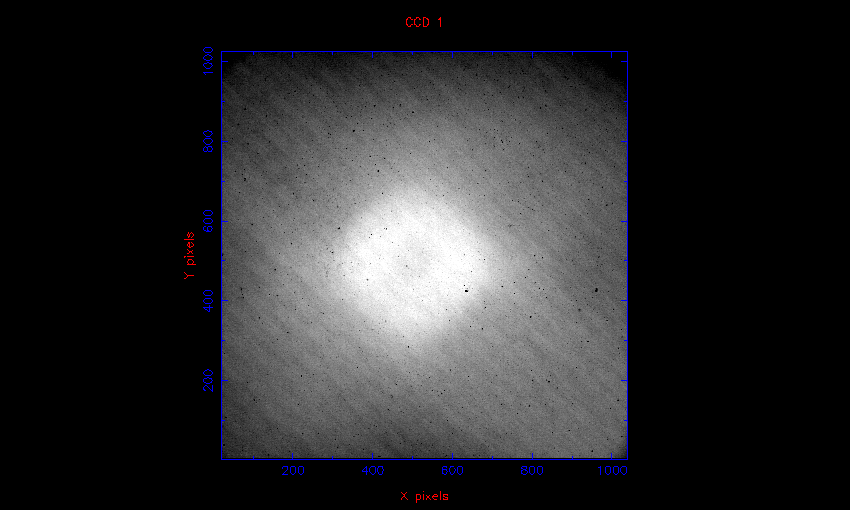

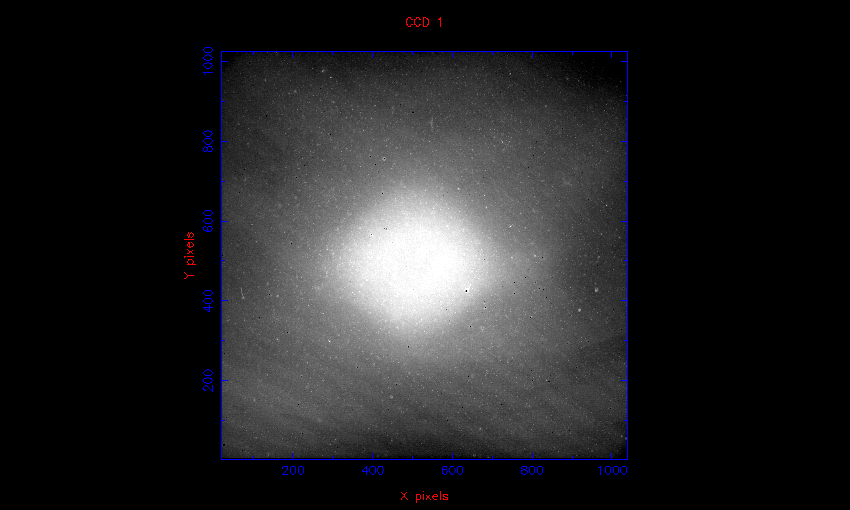
It can be seen that the flats are dominated by a bright central spot, of approximate diameter 300 pixels, which is 5-10% brighter than the surrounding regions. To check whether this is a real sensitivity variation, e.g. due to vignetting, we stepped the cluster NGC6940 (described above) across the field of view in 20 steps in the x direction. We then measured the change in brightness of the same star as a function of position on the chip; the results are shown below for a star near the centre of the chip and for a star near the bottom of the chip.
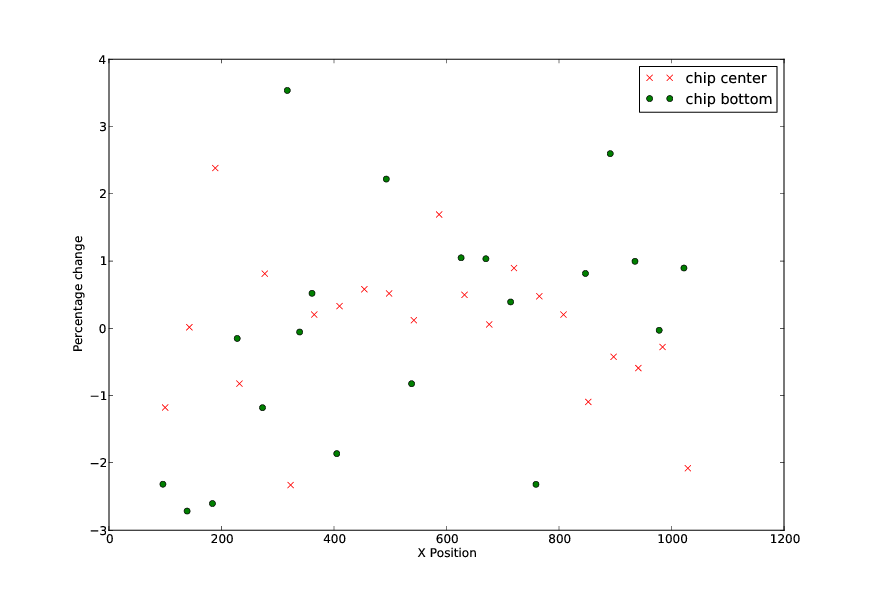
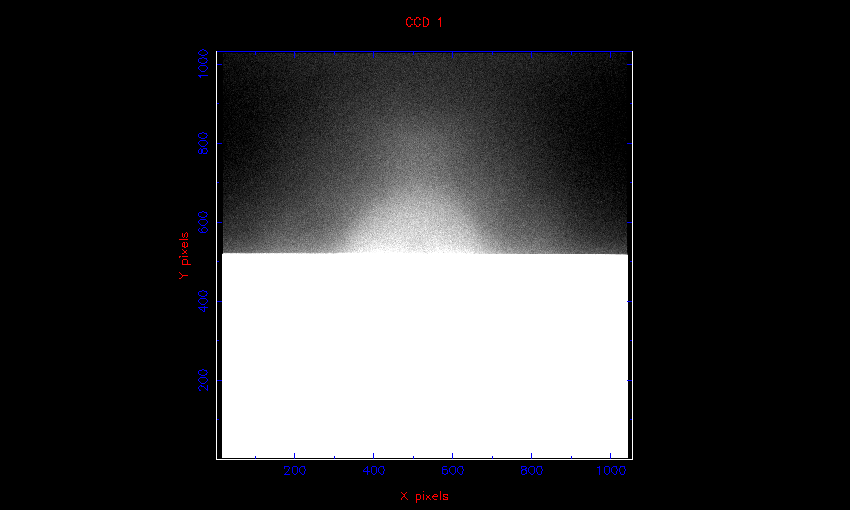
It can be seen that chip is uniform to within ~2% across its entire surface, indicating that there is no serious vignetting in our optics. The bright central spot visible in the flats must therefore be due to scattered light. In order to isolate the source of the scattered light, we took flats with the M4 mirror out of the beam, i.e. removing the effect of the telescope. The spot was still visible, indicating a source within the ULTRASPEC optics themselves. We also took flats without the filters in the beam, and the spot was still visible, indicating a source in one of the ULTRASPEC lens barrels. As an additional test, we took an image with the focal-plane mask obscuring the top half of the chip. The results are shown below, with the left-hand image emphasizing the unmasked half of the chip and the right-hand side the masked half of the chip. The latter image verifies that the source of the scattered light is the ULTRASPEC optics, not the telescope. We tried adding some black self-adhesive felt to the inside of the U-block to fix the problem, but this made no difference. We shall have to investigate this further with ULTRASPEC's optical designer, Tully Peacocke.

The u'-band flat shown at the top of this section also shows a peculiar diagonal-striped structure. These stripes are 5-10% in amplitude and are real sensitivity variations. We verified this by checking our u'-band flats from the ULTRASPEC+NTT run in 2009, which show an identical structure, eliminating the optics and telescope as the cause. We stepped a star diagonally across the chip to check the sensitivity variations - these data are currently being reduced by Liam Hardy, and we expect them to confirm that the diagonal striping is a real sensitivity variation.
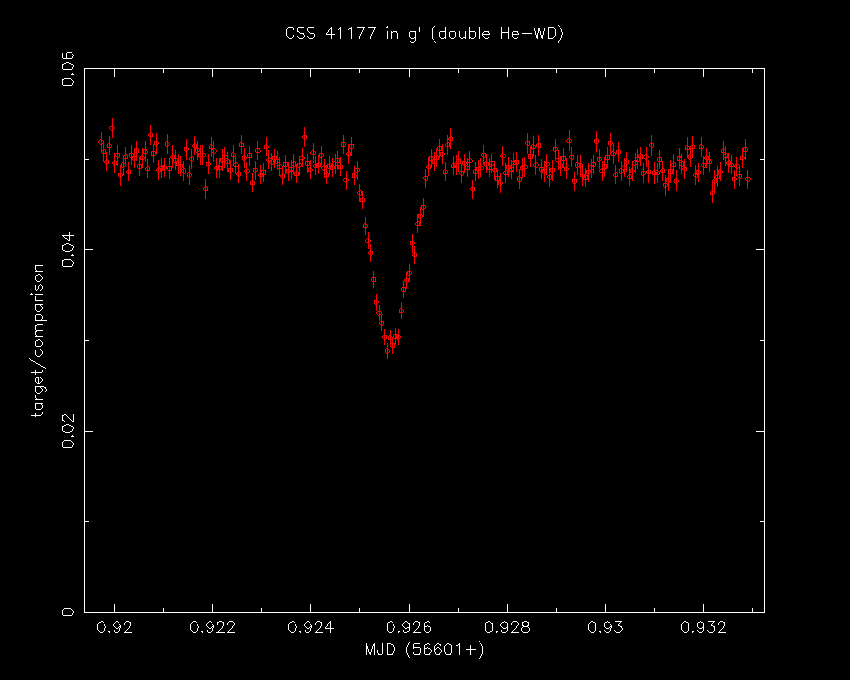
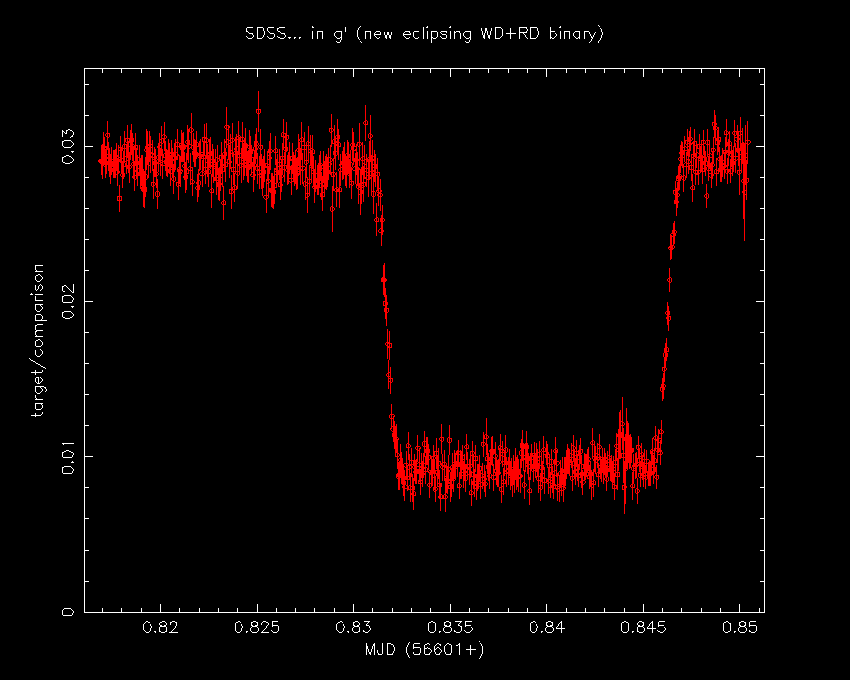
As well as commissioning the instrument, we also observed a few demonstration science targets to assess the performance of ULTRASPEC. From left to right are shown:


ULTRASPEC is now fully commissioned on the 2.4m TNT and ready for full science operations. However, there remain a few minor issues which we need to solve in order to obtain maximum performance of the instrument. These remaining problems are: