| the evolution of high-mass stars |
|
| Figure 19: |
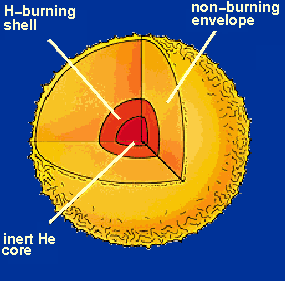
The structure of a high-mass star
(M > 1.1 M |
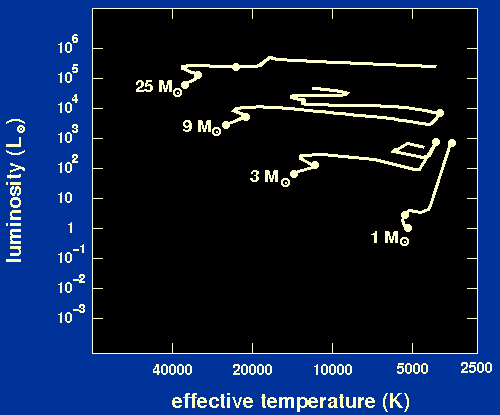
| Figure 20: |
The evolution of high-mass stars depicted schematically on an HR
diagram. The track for a solar mass star is also shown for comparison.
The three dots on each track represent, from left to right, the
main-sequence, the onset of core contraction following hydrogen
exhaustion, and the beginning of helium burning, respectively. |
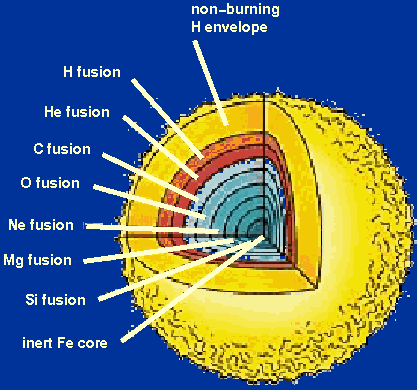
| Figure 21: |
The onion-ring structure of a red supergiant (a pre-supernova star).
Note that this diagram is not to scale - the outer hydrogen burning
shell has a radius of order
10-2 R |
| Figure 22: |
An animation showing the final stages of a Type II supernova
explosion. |

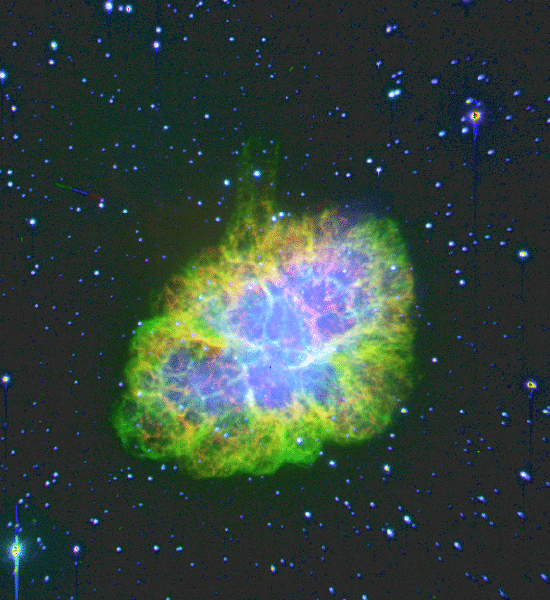
| Figure 23: |
The crab nebula - the remnant of a supernova which exploded about
900 years ago. |
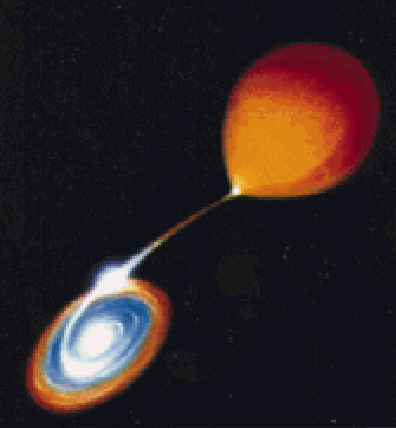
| Figure 24: |
An artists impression of an X-ray binary star, some of which are
believed to harbour black holes. |
