| detailed stellar models |
|
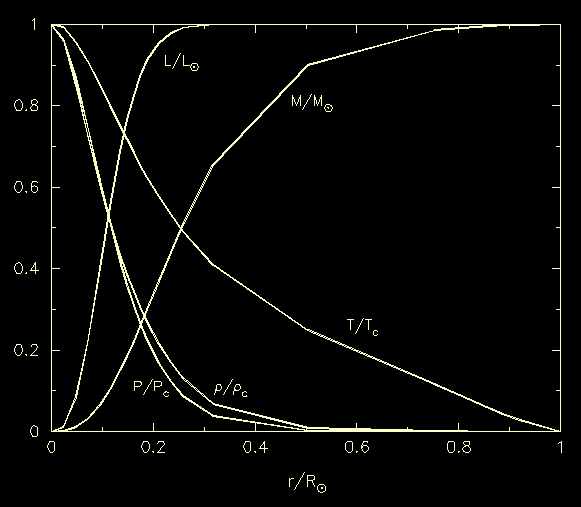
| Figure 21: |
The variation of mass, luminosity, temperature, density and pressure
with radius in a model of the Sun. The mass, luminosity and radius
are given in terms of their surface values, and the temperature,
pressure and density in terms of their central values.
|

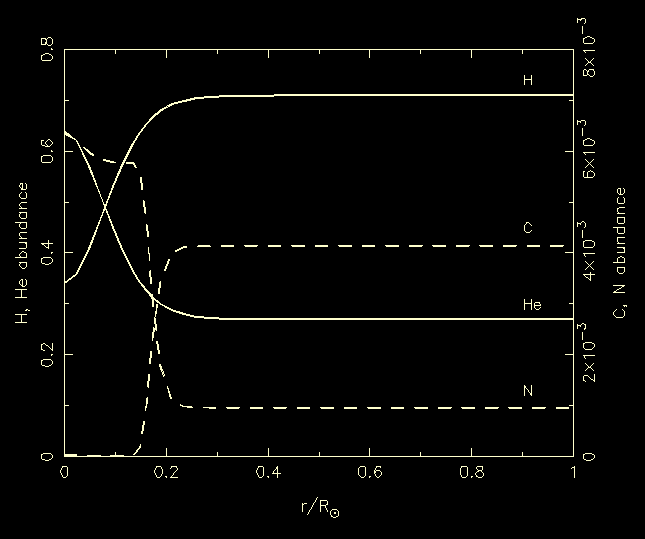
| Figure 22: |
The distributions of hydrogen, helium, carbon and nitrogen in a model
of the Sun.
|

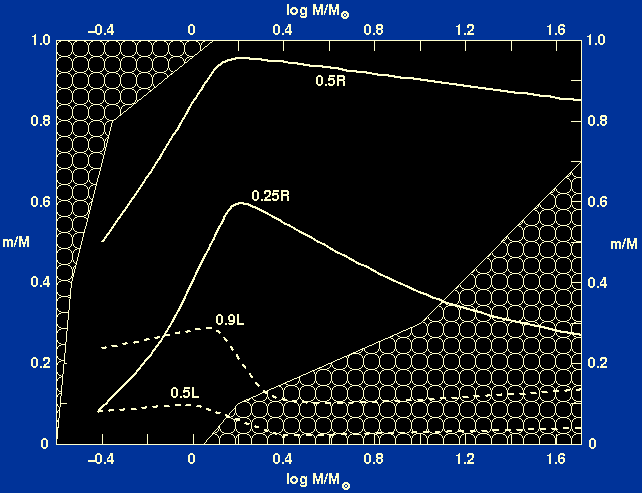
| Figure 23: |
The extent of the convective regions inside stars is shown as a function
of stellar mass. A vertical line in the diagram represents the mass
distribution inside a star of that mass.
`Cloudy' areas indicate convective regions. The solid lines show the mass
values for which the radius is 0.25 and 0.5 of the total radius;
the dashed lines show the masses within which 0.5 and 0.9 of the luminosity
is produced.
|
